Instagram Growth Analysis for Comedy Niche Account
Nature
Data Analytics
Types
Automated Data Collection
Content Strategy Formulation
Data Analysis
Data Cleaning
Data Visualisation
Tools
Python Tableau Instagram API Crontab
Relevant Link
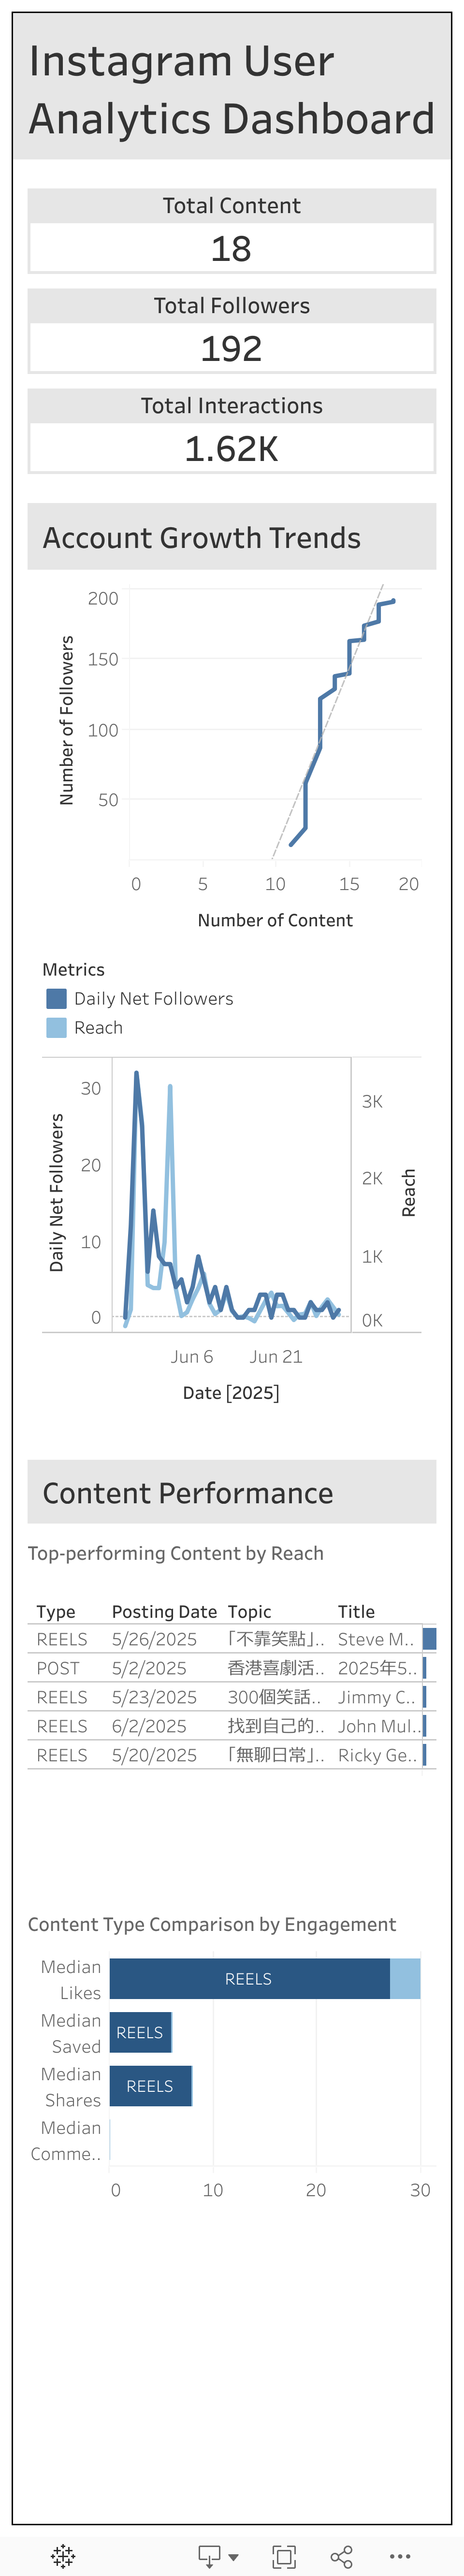
Table of Contents
1. Project Background
Objective
In late April, I started a new Instagram account (@seethis_youfunny) that targets Chinese-speaking comedy fans and comedians. I sought data-driven insights to drive better account engagement and the impact of my personal brand.
This project consists of four parts: Sought data-driven insights to optimise engagement and personal branding for a new comedy-focused Instagram account (@seethis_youfunny) targeting Sinophone (Chinese-speaking) comedy fans and comedians.
Project Workflow
-
Automated Data Collection (Python, Instagram API)
- Daily account metrics (follower growth, post engagement) are extracted via cron-scheduled scripts.
- Scope: Starting at 18 followers in late May 2025.
-
Data Cleaning and Exploration (Python- Pandas, NumPy) [code]
- Addressed missing data via linear interpolation.
- Standardised timezones (HKT) and created derived fields (e.g.,
daily_net_followers). -
Entity Relationship Diagram of the cleaned dataset:
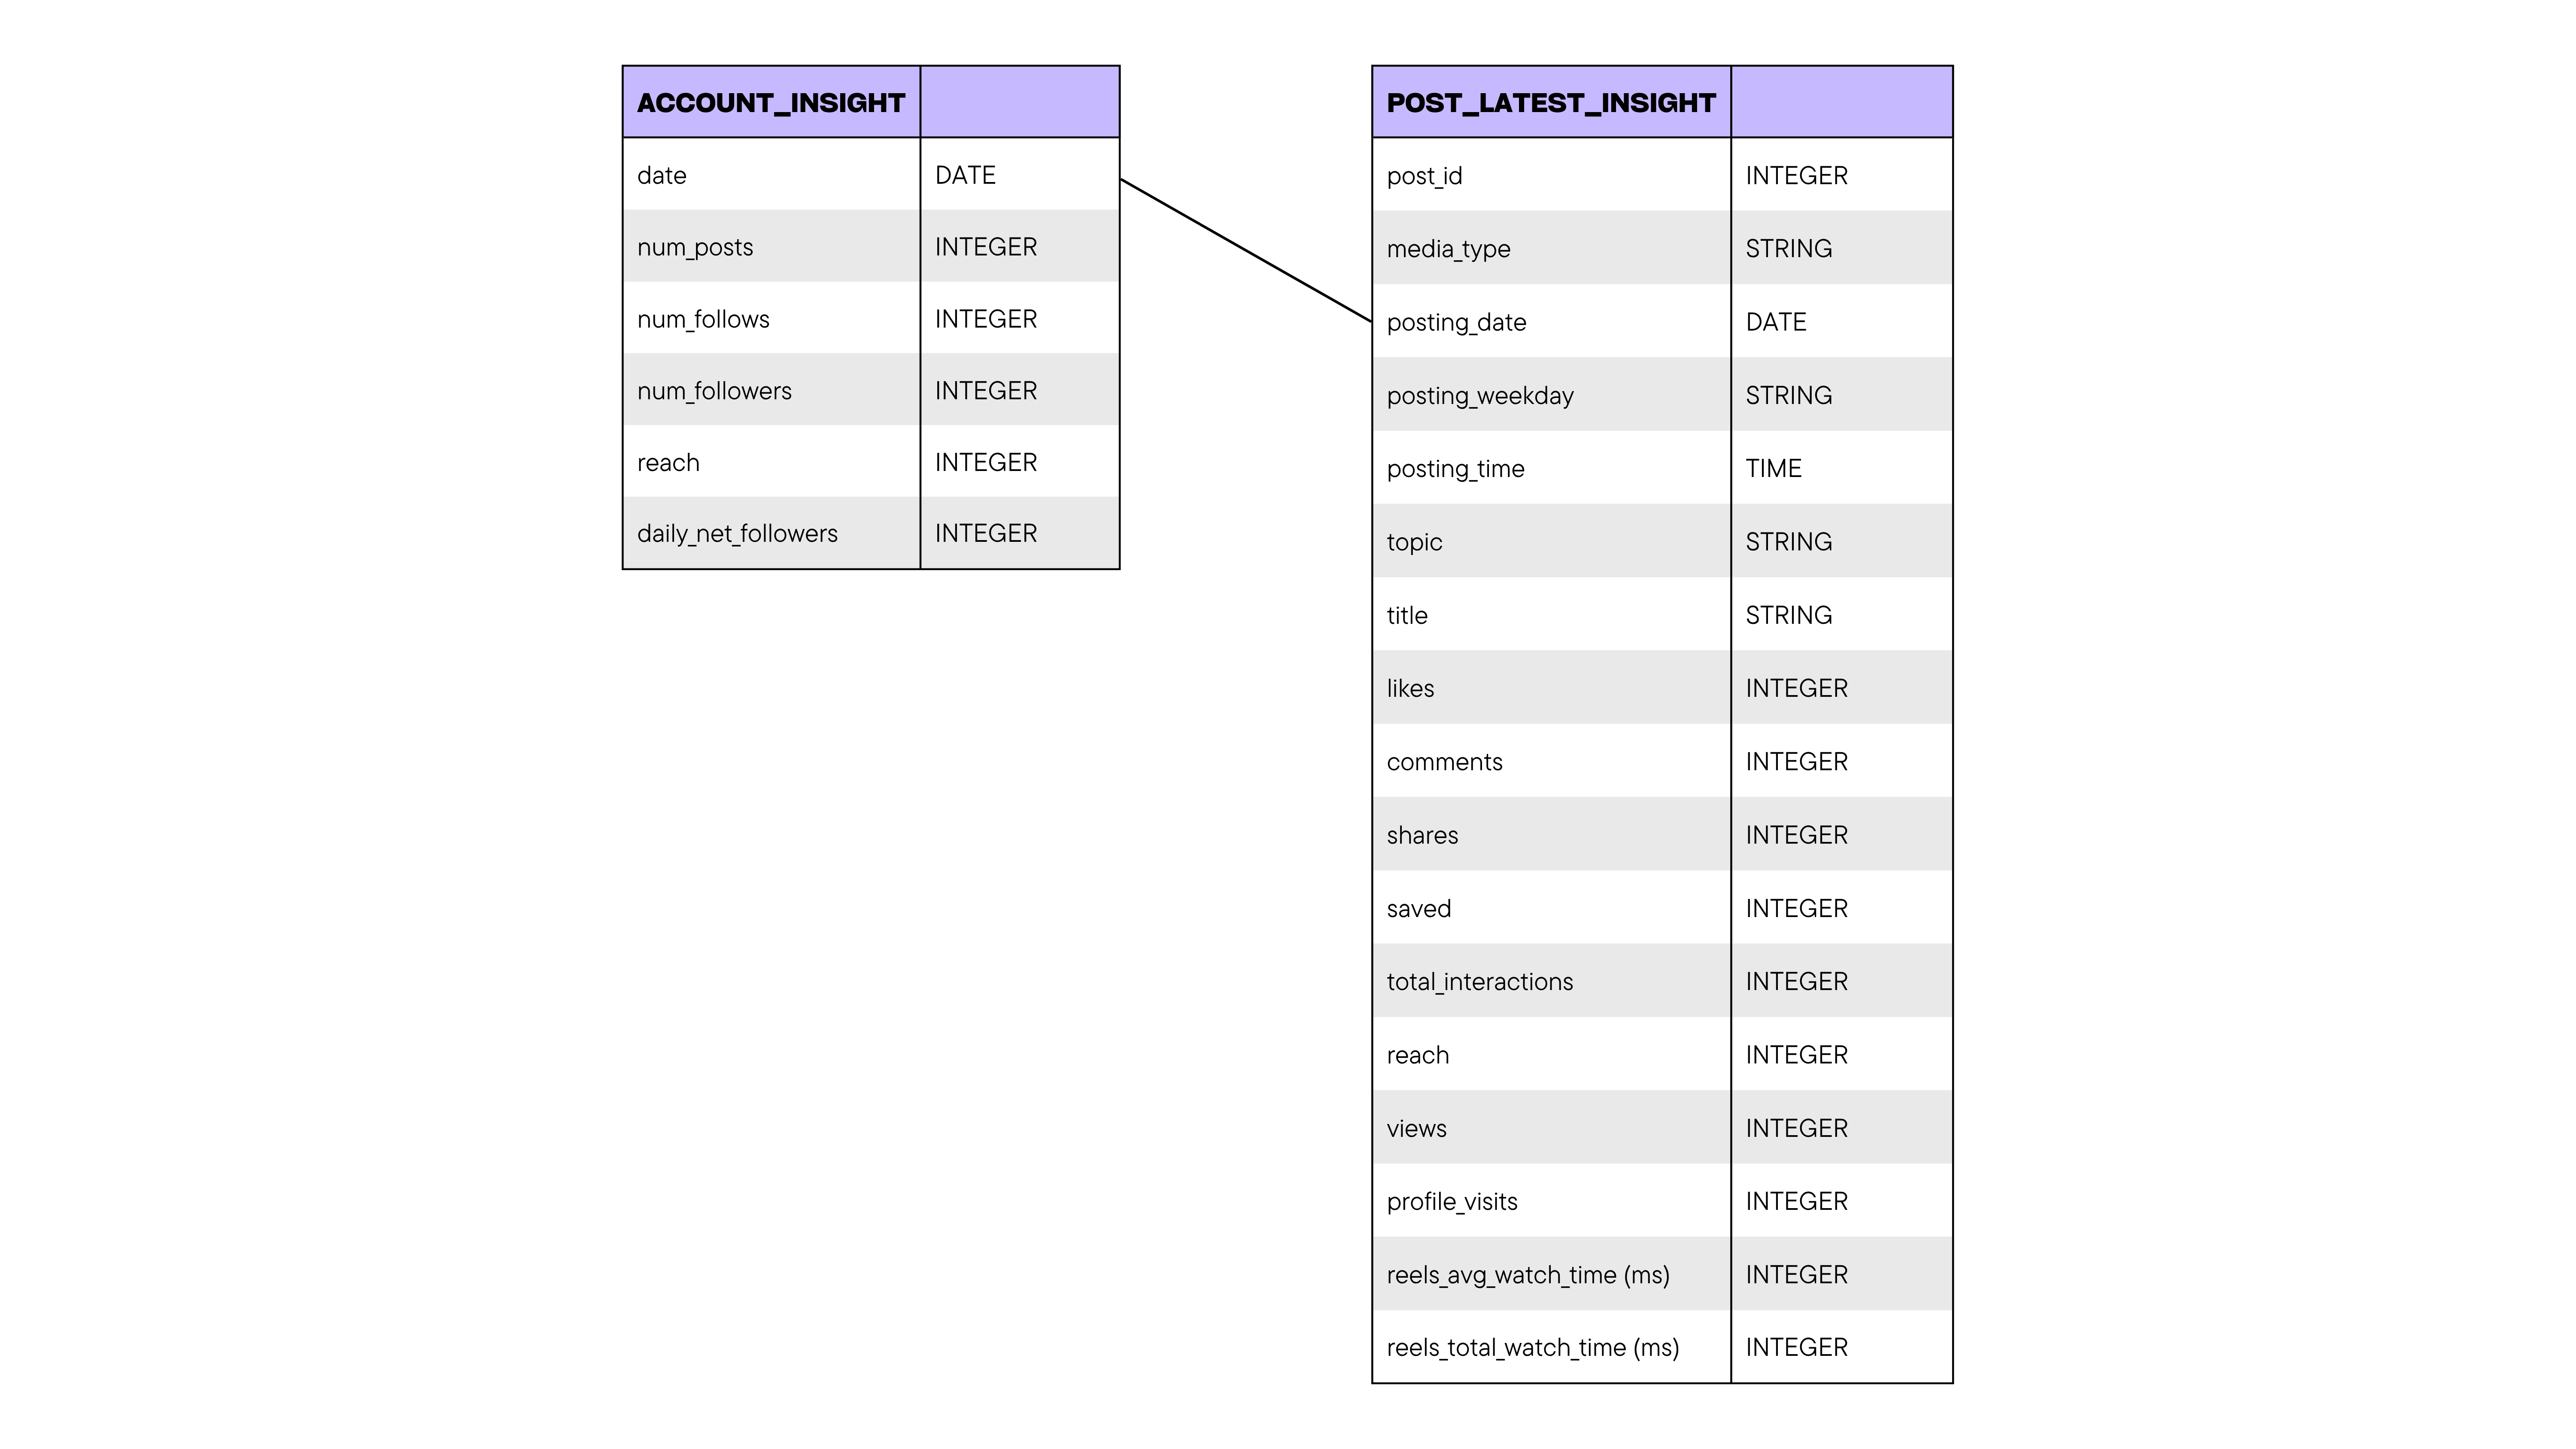
-
Visualisation & Dashboard Building (Tableau) [dashboard]
- Tracked growth trends, content performance, and metric spikes (reach, engagement).
- Identified high-impact content types.
-
Content Strategy Formulation
- Developed a 3-month data-driven content strategy (mid-Jun to Sep 2025) to optimise content creation.
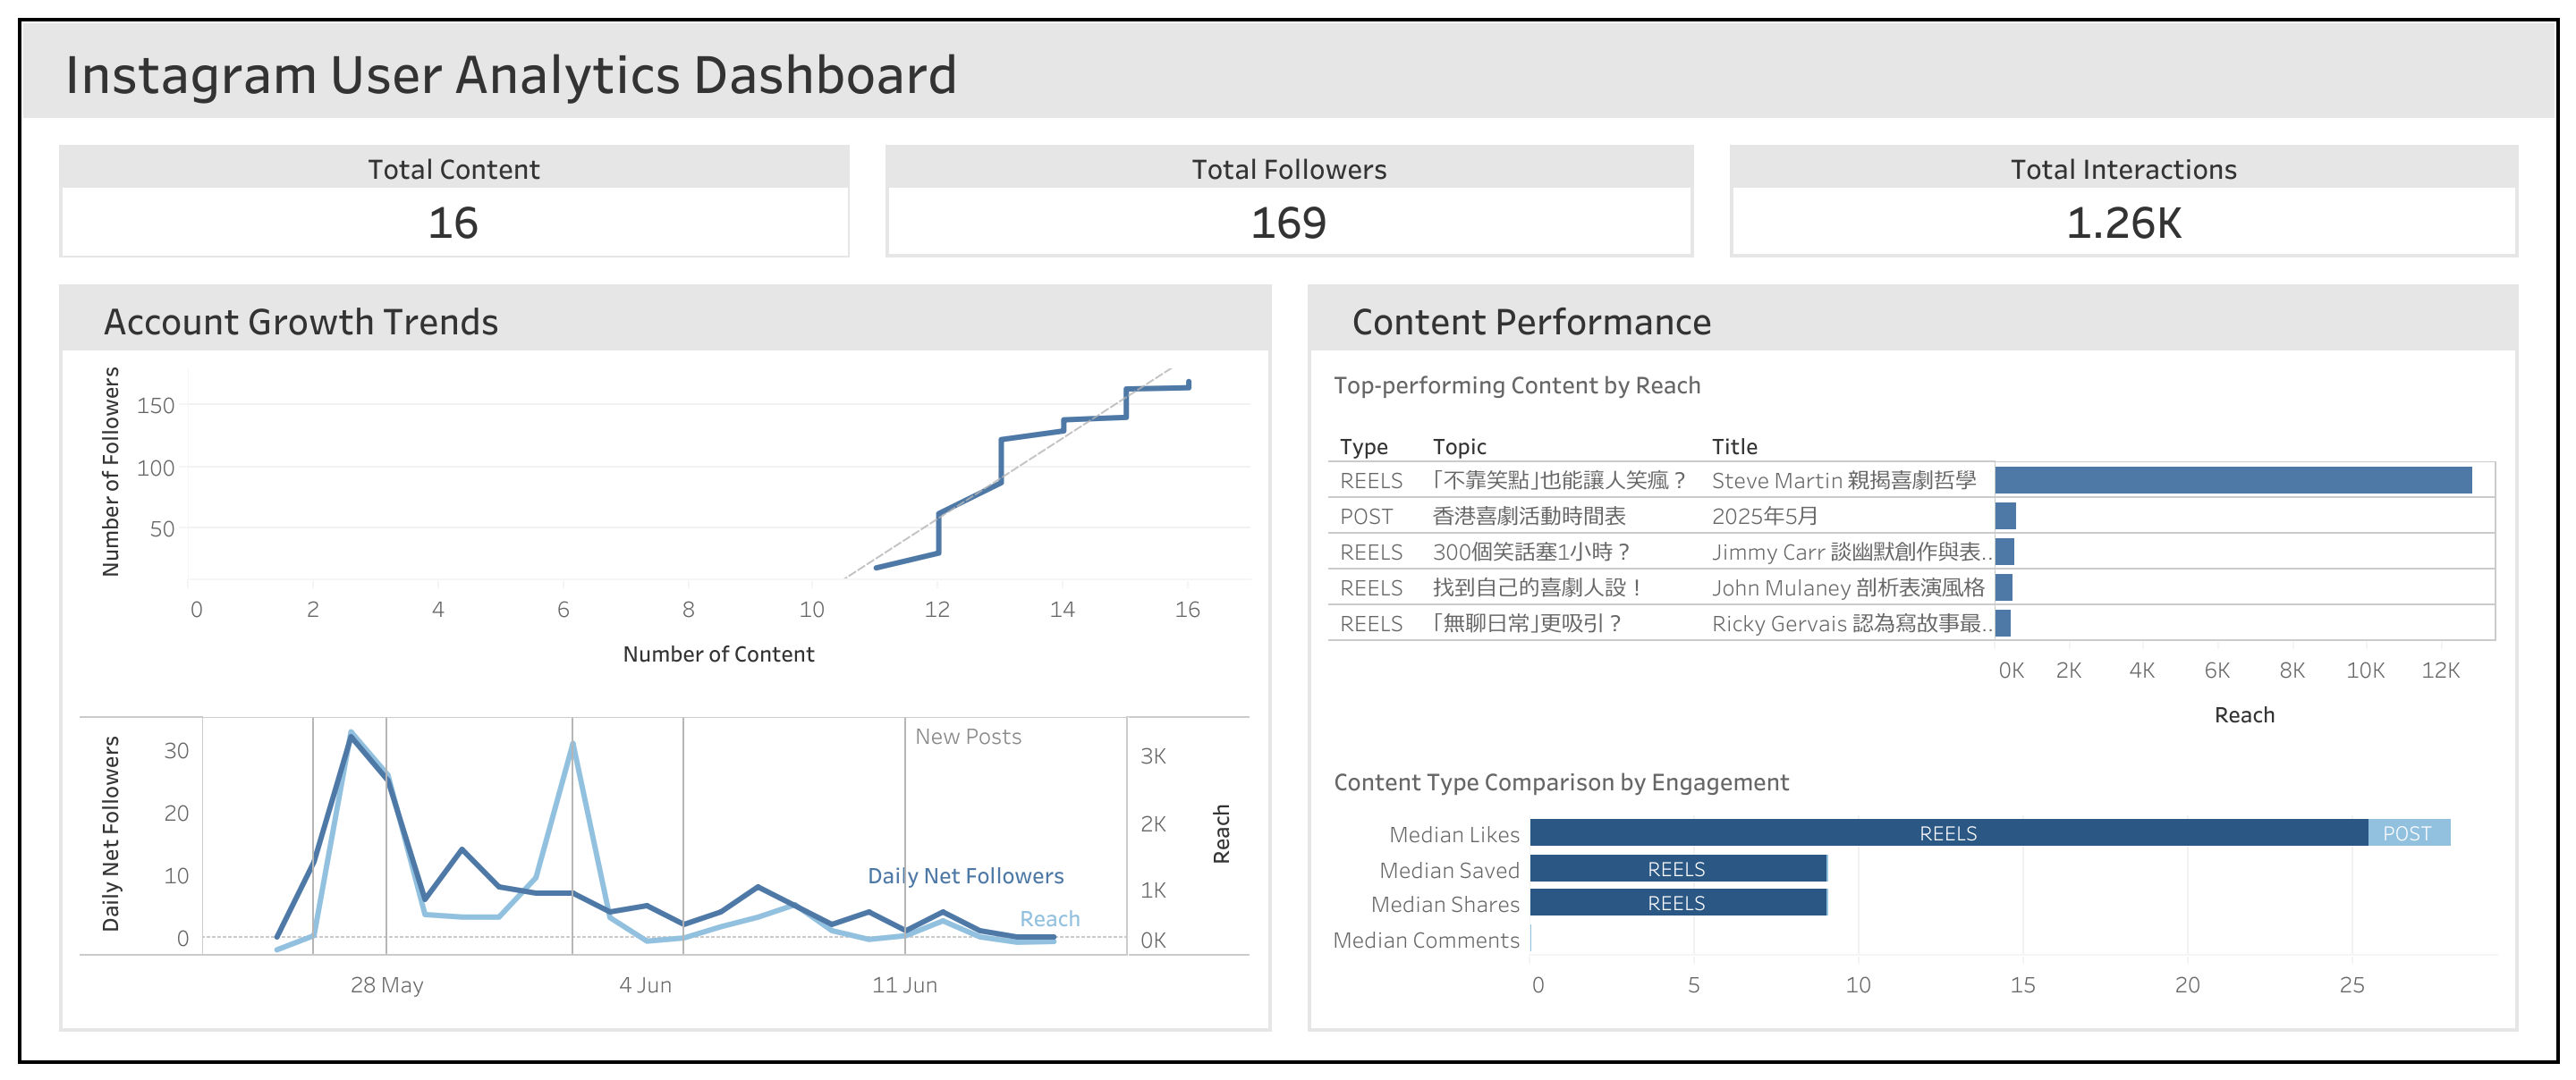
2. Executive Summary (Updated: 15 Jun 2025)
Account Growth (18 → 169 Followers)
- Follower spikes correlate directly with viral Reels, e.g., my 12th content drove +57 net followers.
- Reach surges mostly occurred on the day or a day after high-performing content.
Content Performance (16 Posts - 12 Carousels, 4 Reels)
- Reels outperform carousel posts regarding reach and engagement (likes, shares, saves). 4 out of 5 top content being Reels, and only the monthly event calendar carousel post cracked the top 5.
- Low comment rates across all content types.
3. Proposed Hypotheses
| Insight | Proposed Hypotheses |
|---|---|
| Reach ↔ Follower correlation |
|
| Weak performance of carousel posts |
|
| Low comments |
|
4. Content Strategies (Mid-Jun to Mid-Sep 2025)
Immediate Actions (Jun 2025)
-
Revamp Carousel Post
- Reduce text by 50%.
- Use visually compelling covers.
-
Build connections with my followers using a VTuber avatar
- Build a stick figure VTuber model with GIMP and Live2D.
- Create debut Reels to launch my model.
- Include image stills of the avatar in my content.
-
Establish credibility in comedy by posting original jokes
- Create a secondary account with the same branding as my main account, except it is about making funny memes.
- Feature my avatar as the main character of the memes.
Long-Term Strategy (Jul to Sep 2025)
-
Content Tests
- Reels: Talking-head videos answering comedy questions using the VTuber model, similar to Pikat’s and Rin Penrose’s YouTube Shorts styles.
- Carousel Posts: Informative content that incentivises saves and shares, such as comedy troupe spotlights and open mic guides.
5. Caveats and Assumptions
- Incomplete Data: Missing data from the launch period (28 April to 24 May 2025). Also, the Instagram API fails to collect separate data regarding each Instagram Story.
- Varied Data Collection Time: Crontab fails occasionally, so I sometimes run the Python code manually after the scheduled time.